


It can sometimes feel as though addressing sustainability issues is like playing whack-a-mole, with different issues becoming the latest ‘must do’ every month. For instance, you may consider using a new recycled material but if it has to be shipped around the world from its production location, the greenhouse gas emissions incurred from the transportation may outweigh any savings from the material change. This is just one example of why looking at the whole system is vital for circular design because it will ensure your product is designed in a truly sustainable way.
One powerful tool we use to achieve this is whole system mapping, which illustrates the flows of materials, energy, money, and data in a system. This visualization of the system shows the status quo, and is used as an ideation tool for generating concepts to increase circularity. Along with systems engineering best practices, whole system mapping can ensure that every aspect of the product life cycle is considered and serves as a visual aid in brainstorming alternative system designs.
Whole system mapping for circularity starts by literally drawing out the material flows of the product: from raw material extraction, through manufacturing, distribution, consumer use, and finally to what happens at the end of the product life. By visually mapping out the material flows, it is simple to identify opportunities to reduce the linear flow of materials to landfill and increase the recirculation of materials within the system.
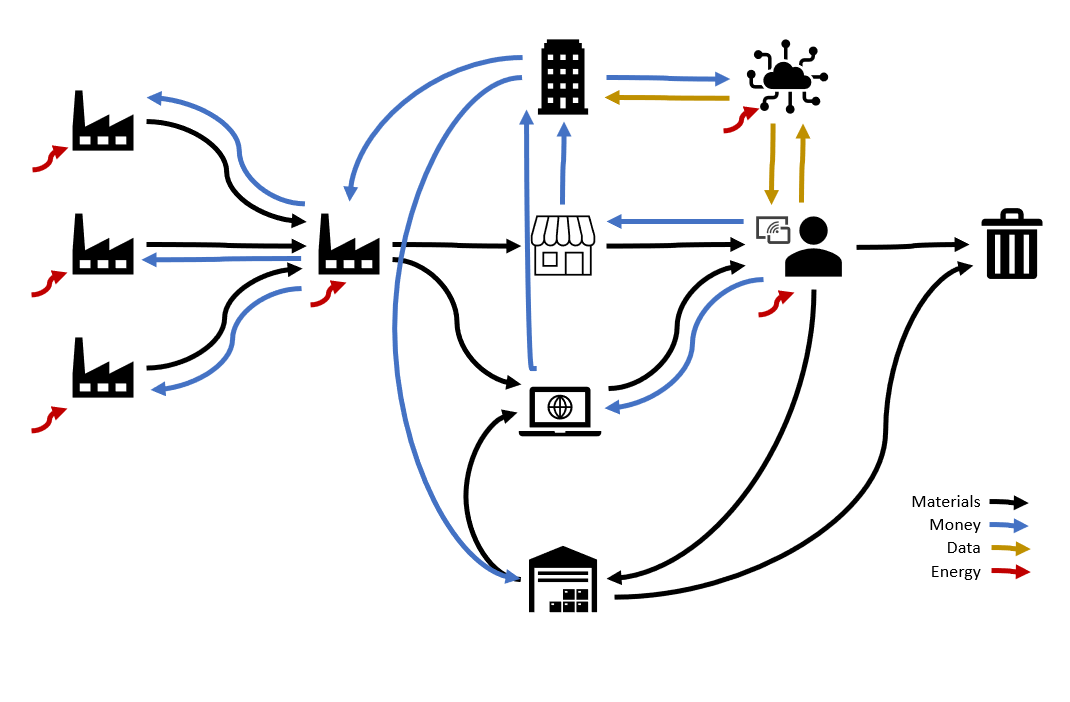
Things get really interesting when you add in the flows of energy, money, and data.
Mapping out the economic flows illustrates the value chain of the product. This can show how shifting to a more circular business model can save money, by reducing the need for raw materials and new components, and removing costs associated with waste disposal.
Understanding how money flows through the system is also essential to understand the incentives of all the stakeholders in a system: from manufacturing partners to consumers.These incentives need to be aligned with a circular business model if it is to succeed. For example, how do you encourage consumers to play their part in a circular system that relies on them to return products instead of throwing them in the trash when they are finished using them? Do you provide a discount for future products if they returned them in their original design? Another example is showing manufacturing partners the financial benefits of supporting circular design changes. If they recirculate refurbished components into their assembly process, they can reduce their spend on new materials.
Data flows can also be a critical facilitator for circular systems. A material flow with no validation or quality control has significantly less value than a material flow with embedded traceability. For example, a pallet of certified post-consumer PET plastic material is worth more to a recycler than a pallet of unknown or mixed material. The chain of traceability is critical to reclaiming any economic value for a circular material. Traceability can be neglected in systems thinking in many situations and is a challenge to implement. But if implemented appropriately, it will pay for itself by the value it creates.
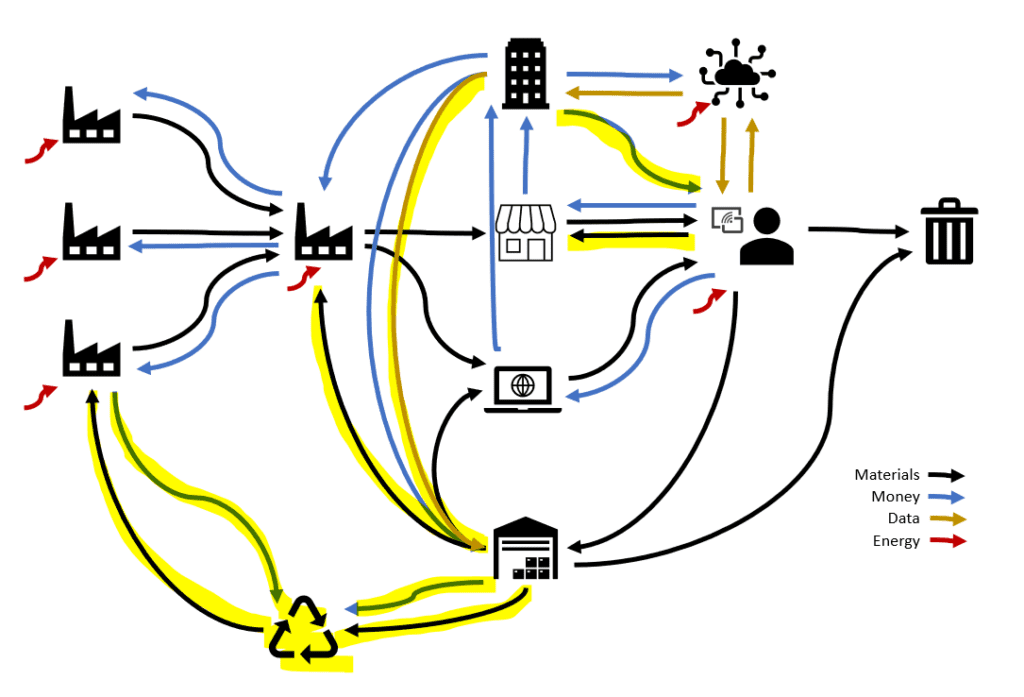
Whole system mapping is a powerful tool in engineering a system to maximize its circularity. Using this early in the product development process ensures the opportunities for changes identified can be implemented with maximum impact. By incorporating circular considerations into the systems engineering process, we can design more sustainable products that support the circular economy.
Credit:
https://venturewell.org/tools_for_design/introduction/
https://www.circulardesign.it/circular-design-forum/